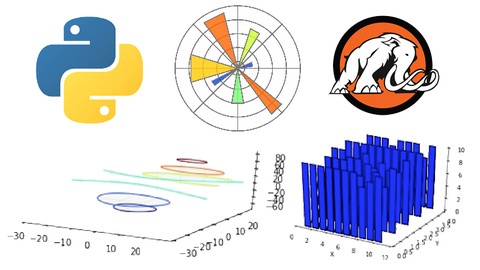
A data science masterclass for beginners! Learn data visualization by making graphic bars and diagrams. Code in Python.
What Will I Learn?
- Code in the Python 3.5 programming language.
- Make games with Python.
- Create basic line and scatter plots with Matplotlib 1.5.
- Read finance data directly from Yahoo.
- Customise our graphs with visuals, a title, labels, text and a legend.
- Recognize types of visualization: histograms, pie charts, and box and whisker plots.
- Make candlestick plots.
- Understand figures and subplots.
- Perform in-depth customization of plot structure
- Understand basic 3D plotting.
Includes
- 27 hours on-demand video
- 3 Articles
- Full lifetime access
- Access on mobile and TV
- Certificate of Completion
Requirements
- Download Anaconda 4.2.0, the free data science platform by Continuum, which contains Python 3.5.2 and Matplotlib.
- Otherwise, you can download and install Python 3.5.2 and Matplotlib for free online.
- Topics involve intermediate math, so familiarity with university-level math is helpful.

Comments
Post a Comment